Yield-tokenization profit surface.
A discrete-time simulator for a staking yield-tokenization protocol — validator accounts, Principal Token (PT) and Yield Token (YT) minting, secondary trading, and profit distribution across four stakeholders. Built to size the protocol-vs-staker-vs-validator split before launch, not after.
Stakers deposit a yield-bearing asset; the protocol mints two fungible claims against it. The Principal Token (PT) settles for the deposit’s face value at maturity. The Yield Token (YT) entitles its holder to the deposit’s accrued yield until maturity. Both PT and YT trade on a secondary market. The protocol takes a commission on the yield stream; a validator pool earns delegation fees; remaining yield flows to YT holders.
The design question: what commission rate and fee split make the protocol viable without starving any of the other three sides? A naive answer — “set the protocol fee to N%” — collapses on contact with realistic deposit and velocity assumptions. Some configurations that look reasonable on a back-of-the-envelope basis turn out to allocate zero or negative surplus to stakers across realistic horizons, which means no growth.
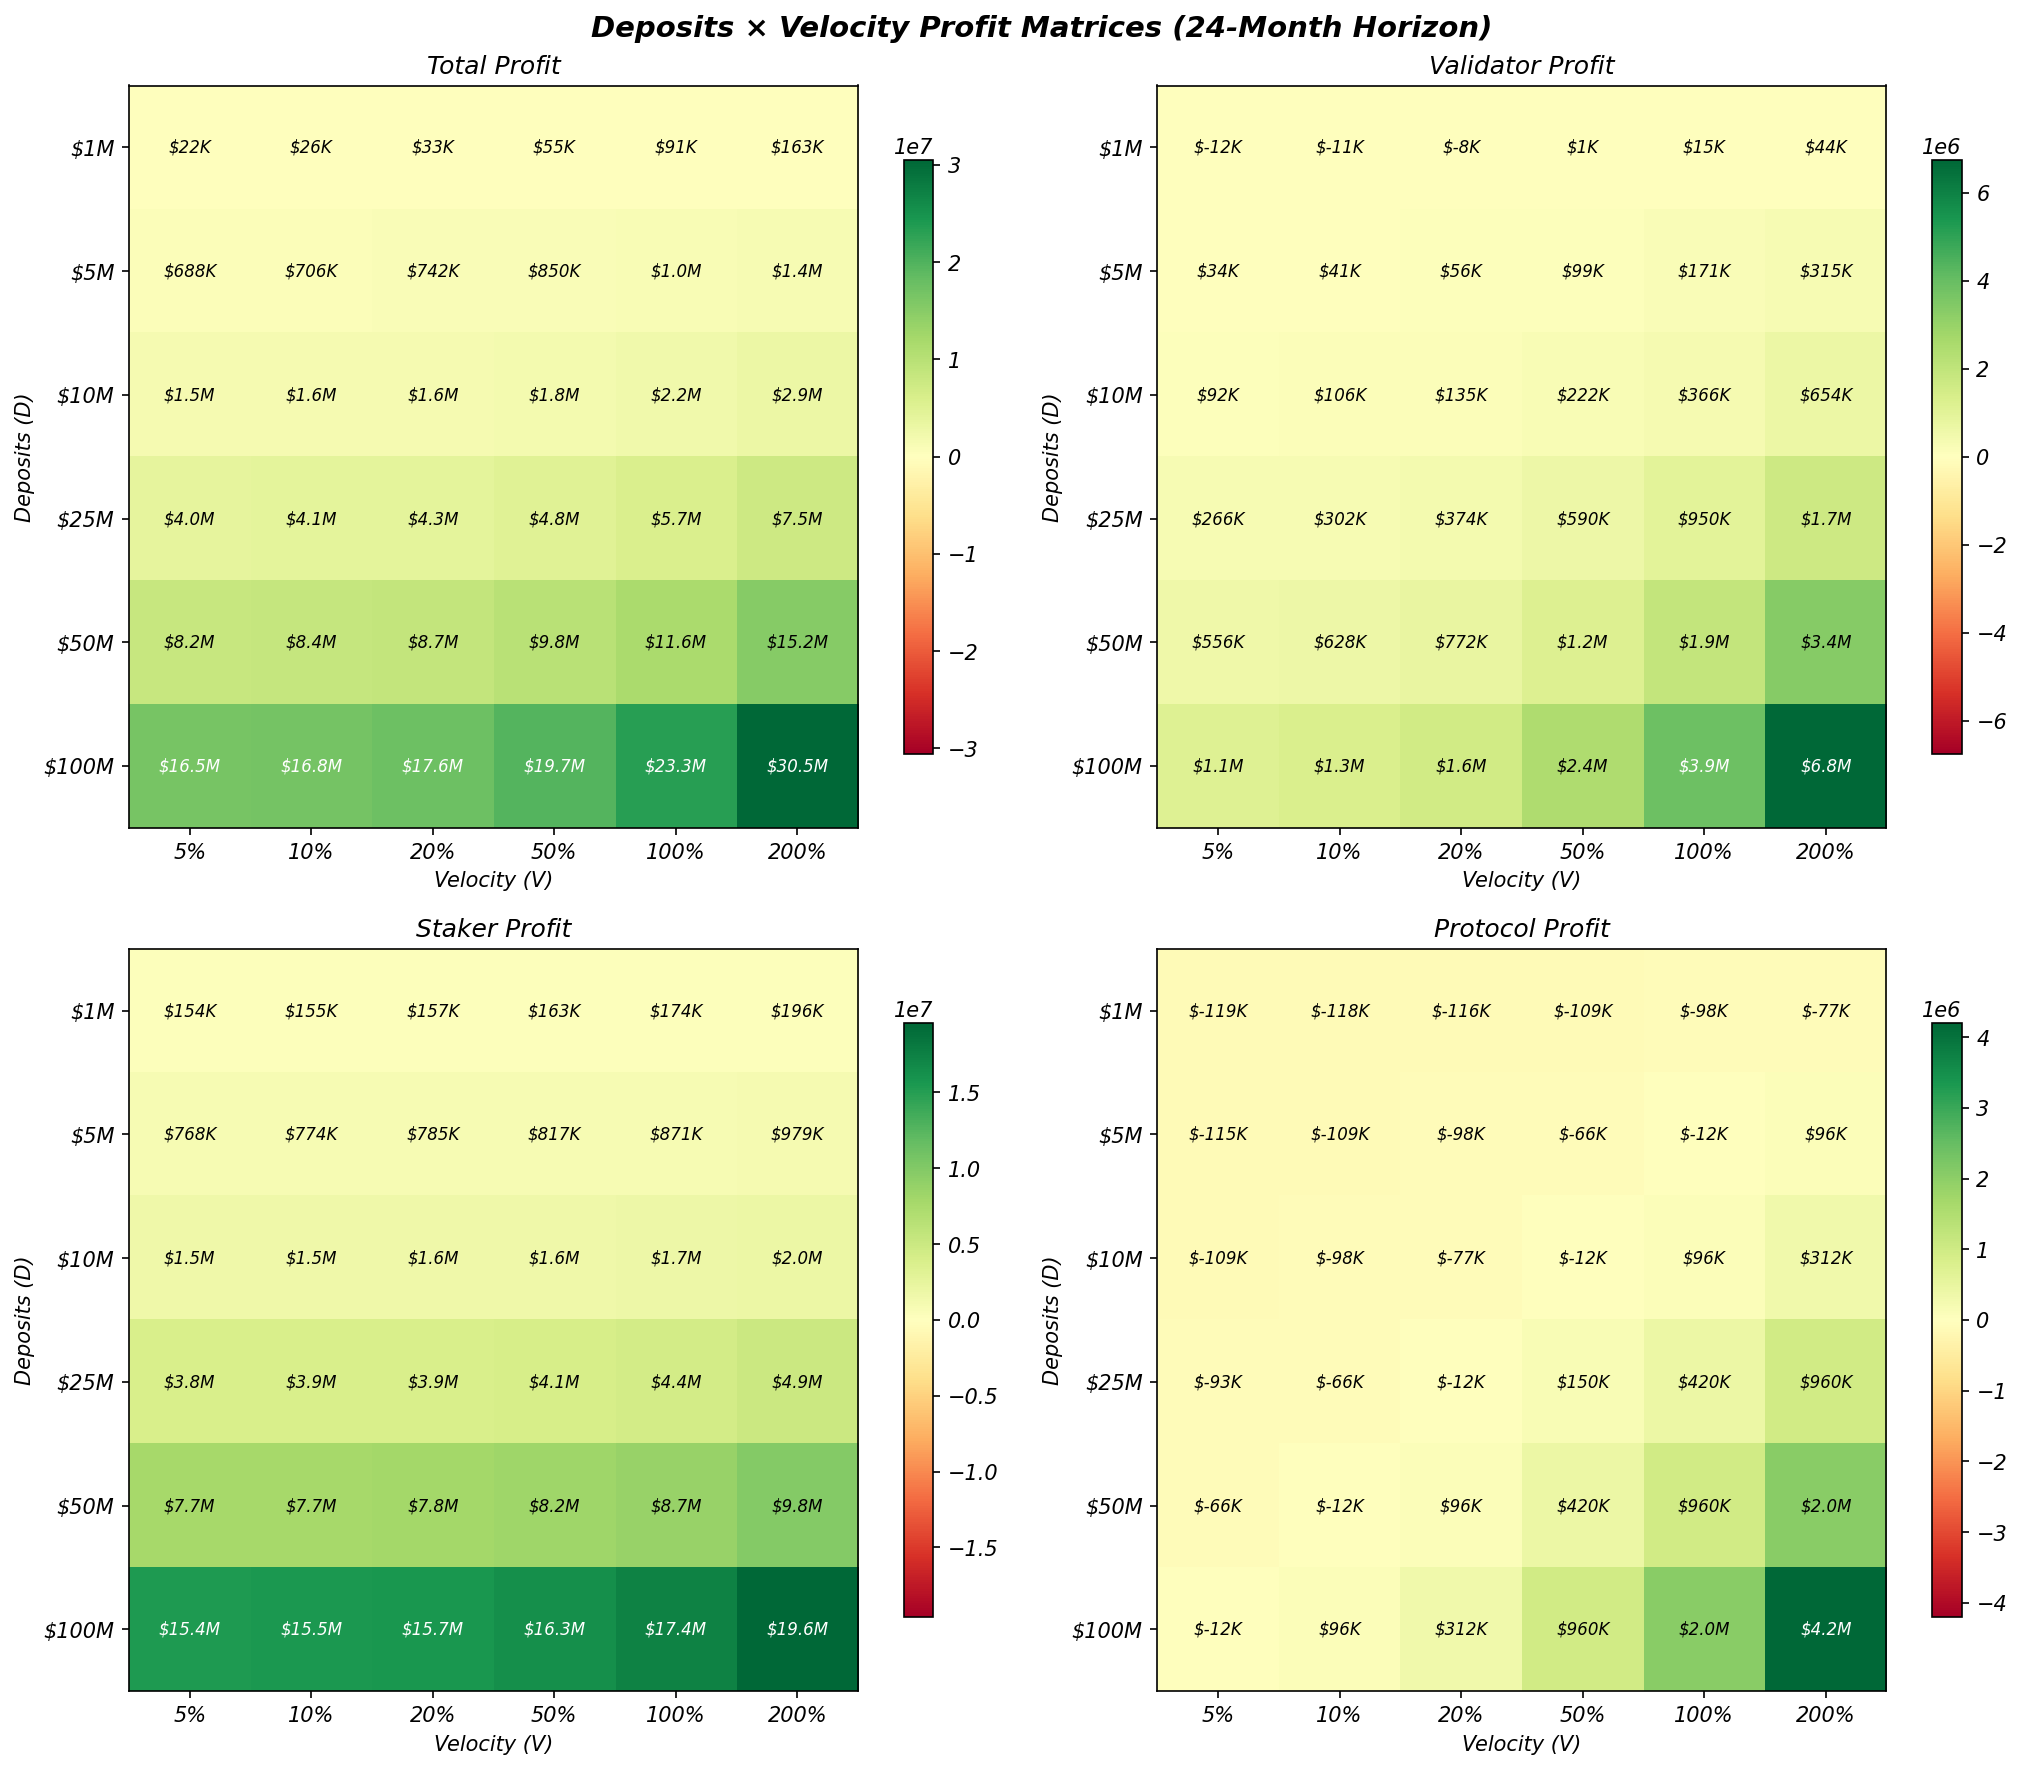
Profit-matrix output. Four heatmaps, one per stakeholder (total, validator, staker, protocol), each rendered over a (deposit volume × secondary-market velocity) grid for a single 24-month horizon. Green is surplus, red is loss. The objective: pick a commission and fee split such that all four heatmaps stay positive across the realistic operating region.
State. The simulator tracks a population of validator accounts and a stream of staker accounts. Each block accrues yield deterministically given a base staking-yield schedule; each tick can mint, trade, redeem PT/YT, or churn stakers in or out at a configurable velocity.
Accounting. The protocol commission and validator fee are taken at yield-accrual time; remaining yield flows through PT/YT settlement at maturity. Secondary-market trades are modelled at the prevailing implied-yield curve; no AMM frictions are baked in (this is a ‘clean accounting’ simulator — frictions are layered on as a separate sweep).
Sweep. We sweep deposit volume across [$1M, $100M] and secondary-market velocity across [5%, 200%] of book-per-month, holding commission and fee split fixed. Repeating the sweep across a grid of (commission, split) pairs gives the full 4-D surface. The interactive widget will let you scrub the commission/split axes and watch the four heatmaps respond in real time.
TRY IT: PROFIT-MATRIX SOLVER
Move the four sliders. The 4×6 matrices below recompute the protocol-vs-staker-vs-validator profit split across deposit volume and secondary-market velocity, in real time. Green is surplus, red is loss.